Introduction
The Dow Jones Industrial Average (DJIA) is a widely followed stock market index that represents a cross-section of the U.S. stock market. Investors and analysts closely monitor the index for insights into market trends and potential investment opportunities. In this article, we will delve into the technical aspects of the DJIA, examining various indicators, oscillators, moving averages, and pivots to provide a comprehensive analysis of its current state based on daily timeframe.
Technical Indicators Overview
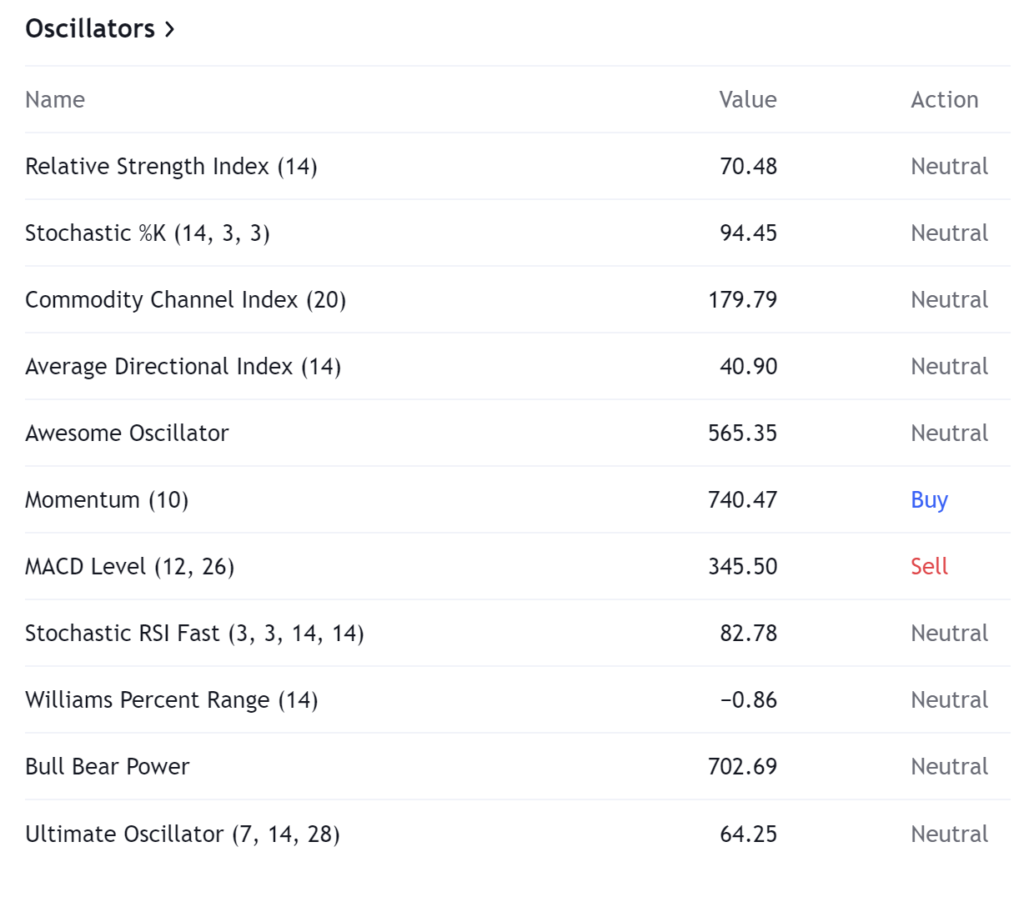
Oscillators play a crucial role in assessing the momentum and potential direction of the market. The DJIA’s current oscillators present a mixed picture. While the Relative Strength Index (RSI) stands at 70.48, indicating a neutral stance going towards the oversold zone, the Stochastic %K and Commodity Channel Index both suggest a neutral sentiment at 94.45 and 179.79, respectively.

Other indicators, such as the Awesome Oscillator, Momentum, and Bull Bear Power, also lean towards a neutral stance, emphasizing the uncertainty in the market.

Moving Averages Analysis

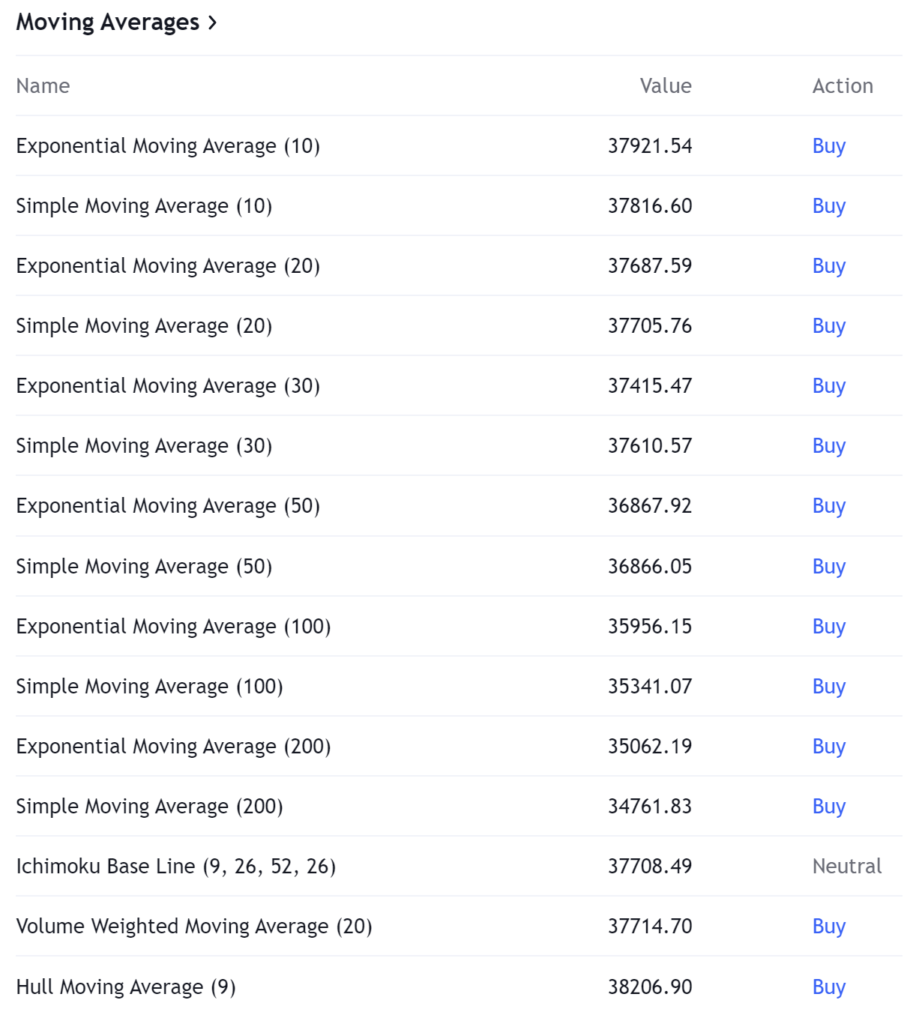
Moving averages are essential tools for smoothing out price data and identifying trends. The DJIA exhibits a mix of buy and sell signals across different moving averages. Short-term indicators, including the Exponential and Simple Moving Averages (10, 20, and 30), signal a bullish trend with a “buy” recommendation. However, longer-term indicators, such as the Exponential and Simple Moving Averages (100 and 200), also indicate a bullish sentiment, suggesting a robust trend in the market.

The Ichimoku Base Line, Volume Weighted Moving Average, and Hull Moving Average provide additional insights. The Ichimoku Base Line, with a neutral stance at 37708.49, adds another layer of complexity to the overall analysis. Meanwhile, the Volume Weighted Moving Average supports the bullish sentiment with a “buy” recommendation. The Hull Moving Average further reinforces the positive outlook, signaling a “buy” recommendation at 38206.90.
Pivot Points Examination

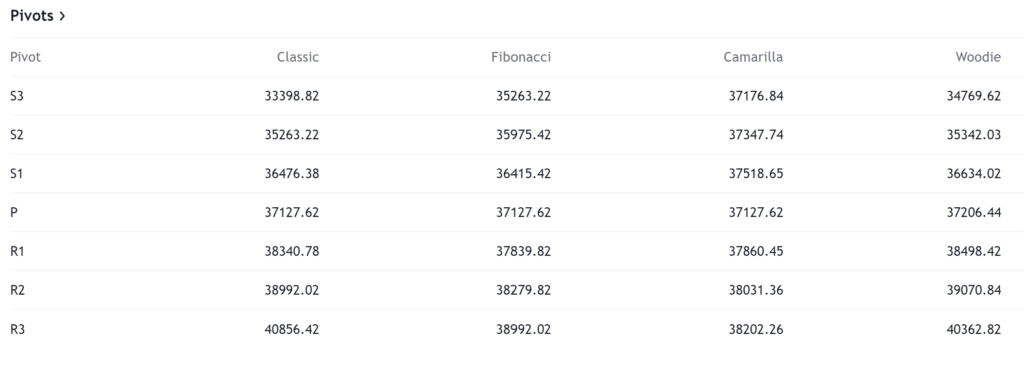
Pivot points are critical levels used to identify potential support and resistance areas. The DJIA’s pivot points, classified into Classic, Fibonacci, Camarilla, Woodie, and DM, offer a nuanced perspective. While Woodie’s pivot points indicate a bearish sentiment at S3 and S2, the Classic, Fibonacci, and Camarilla pivot points suggest a predominantly bullish stance, with higher resistance levels (R1, R2, and R3). Traders and investors need to carefully consider these pivot points to make informed decisions in response to market movements.
Final Conclusion on 30th Jan 2024 Trade
In conclusion, the technical analysis of the Dow Jones Industrial Average reveals a complex and dynamic market scenario. While oscillators portray a slightly bullish to neutral sentiment, moving averages and pivot points provide a more optimistic outlook, indicating potential buying opportunities. Investors should exercise caution and consider the broader economic context, geopolitical events, and other fundamental factors before making investment decisions. The DJIA’s technical indicators serve as valuable tools, but a comprehensive approach that integrates various analytical methods is crucial for making well-informed investment choices in the ever-evolving financial landscape.
